Development Tools Development Tools

smxAware
Debug and Monitoring Tools
smxAware adds SMX® awareness to popular embedded debuggers from other vendors. It is included with the smx kernel and offers graphical and textual displays. smxAware Live is a version for monitoring systems in the field, available as an extra cost option.
smxAware is available for IAR EWARM and Freescale CodeWarrior. It is accessible from the debugger menu.
Here is a demo that runs on Windows without any tools or hardware.
Graphical Displays
smxAware graphical displays allow you to visualize system operation. A few screen shots are show below, but we recommend that you try it (see the note above).
These displays are available when execution is stopped at a breakpoint. smxAware also runs standalone to allow you to analyze collected data offline.
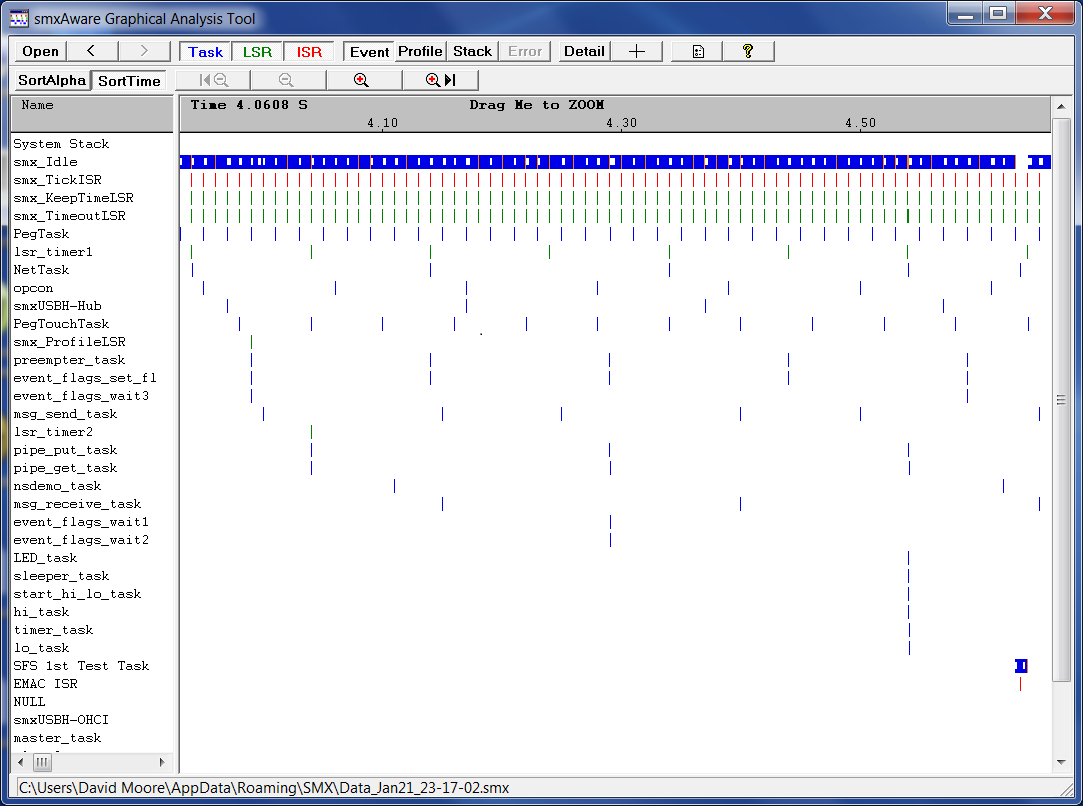
Event Timelines
(click for larger view)
This view shows when tasks, LSRs, and ISRs ran. Inside the bars it shows when SSRs (smx kernel calls) occurred. User events can also be added to the application. This display can be zoomed to a very fine level of detail. Time resolution can be microseconds, or less, depending upon the capture rate in the target. When the Details button is pressed and the mouse cursor is moved over an event, information about the event appears in a small window next to the cursor. For an smx kernel call, this information includes the name of the call, all parameters, and the return value. Hence, the display is clean and uncluttered, yet it is easy to get detailed information about events.
Event timelines are an important visualization tool needed to understand and debug modern, complex embedded systems. The precise time that each ISR, LSR, or task started and stopped is shown, along with the cause. Timelines can be moved or resorted by sequence of occurrence. This is helpful to focus on the few timelines of interest at the moment. The display can be zoomed in or out and scrolled left or right and up or down, if there are too many timelines to fit the screen. Line thickness can be reduced to get more on the screen. Filter buttons control what types of events display. Prior to zooming, a reference point can be set, which stays fixed while zooming. These and other features make the smxAware timeline display convenient and effective.
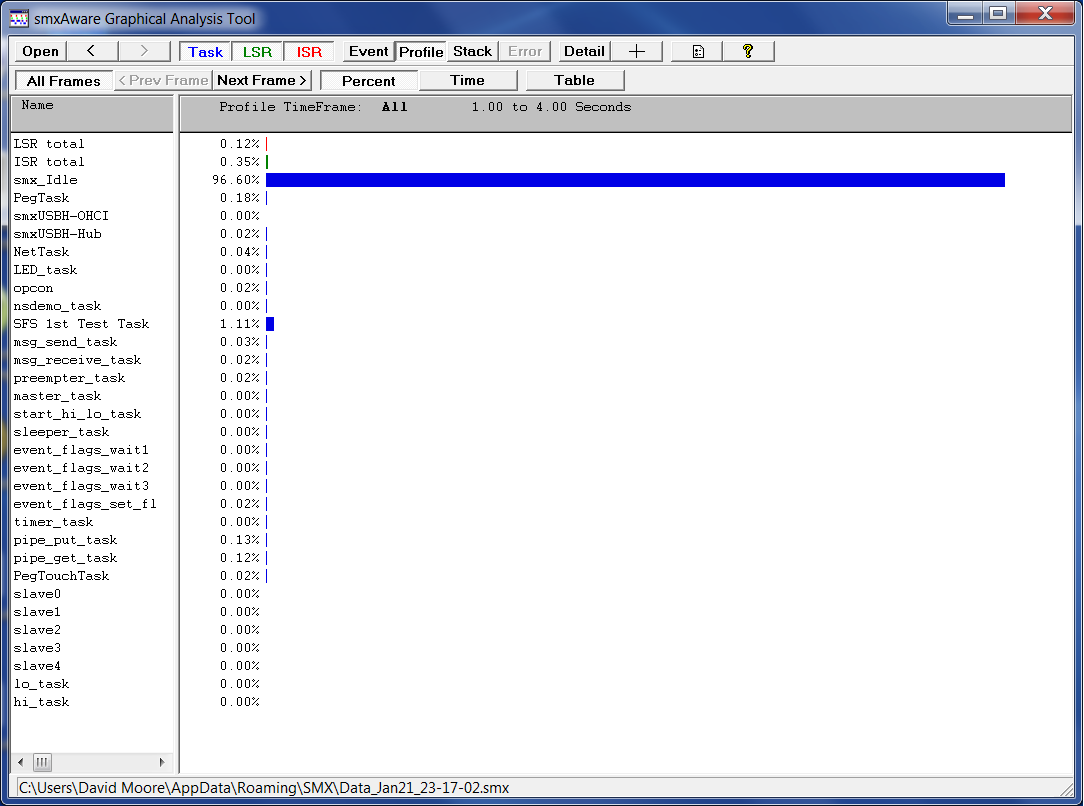
CPU Usage
(click for larger view)
This view shows how much time each task, lsr, and isr ran during the sample period, as a percent of the sample period. Known as "task profiling", this window helps to resolve performance issues. (Note that in the diagram to the left the idle task, which has lowest priority, is running most of the time. Hence there is plenty of bandwidth for useful work in this system.)
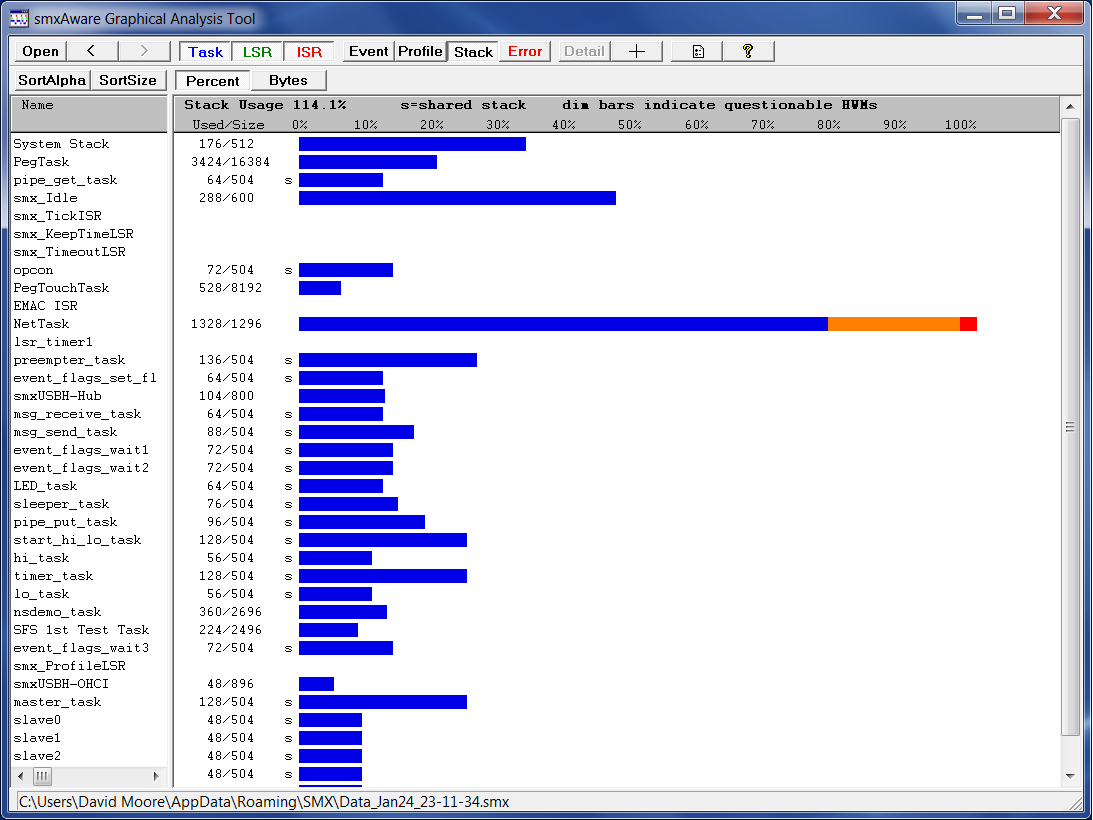
Stack Usage
(click for larger view)
This view shows how much stack each task uses. Orange indicates stacks that are close to overflow. Red indicates stacks that have overflowed. To the left of each bar is the actual number of bytes used and stack size. The bars show percentages. Stacks can overflow without halting the system due to padding allocated adjacent to each (size is configurable). Without this display, stack overflow is often very difficult to debug in a multitasking system.
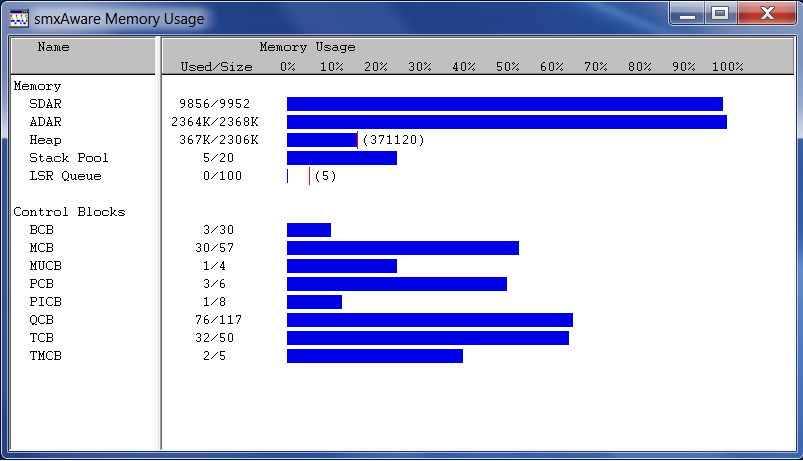
Memory Usage
 (click for larger view)
This view shows a summary of memory and control block usage in the system. Red tick marks for some show high water marks.
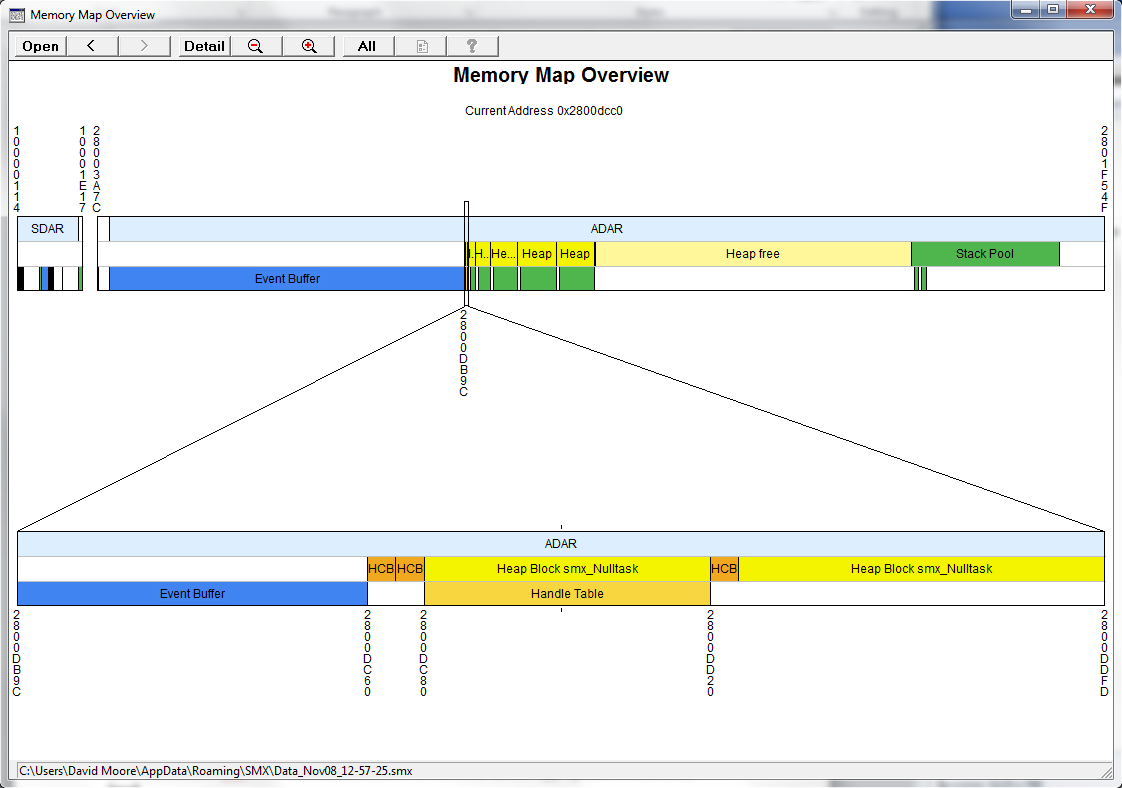
Memory Map Overview
 (click for larger view)
This view shows an overview of the memory layout of the system, with the ability to zoom in for increasing detail, down to the byte level, much like Google Earth. Objects are labeled, and they can be opened in a data window to see the actual bytes in memory. Finally, you can visualize the memory layout of your system! Seeing the proximity of one object or region to another may give clues about the cause of a problem, especially a suspected overflow. This screenshot shows a small section of the beginning of the heap, in the lower band. Notice the HCBs and blocks are visible, as well as any smx objects allocated from them, such as the handle table and task stacks.
Textual Displays
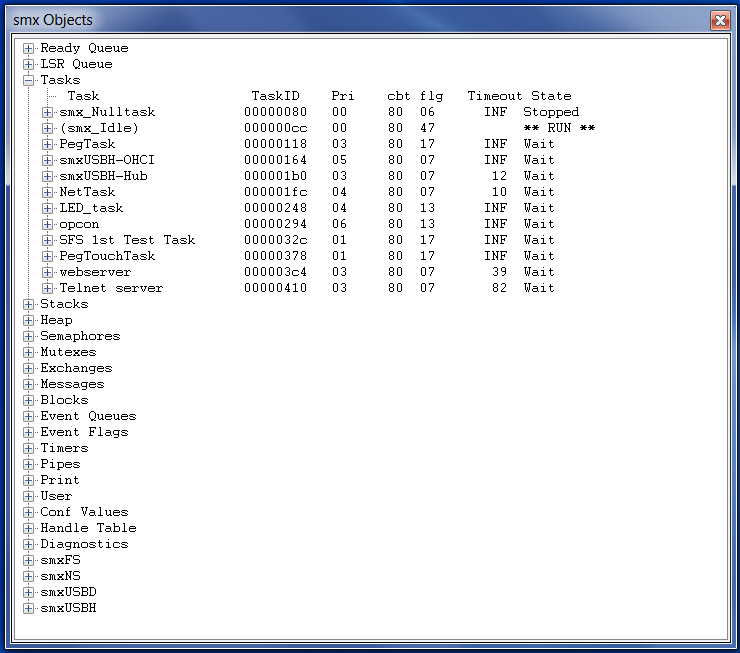
smxAware presents a list of the following object types:
| Tasks |
Events |
Heaps |
| LSRs |
Event Tables |
Stacks |
| Exchanges |
Ready Queue |
Print Statements |
| Messages |
Timers |
Handle Table |
| Semaphores |
Pipes |
Diagnostics |
| Mutexes |
Blocks |
|
When one is selected, all objects of that type are displayed. A one-line summary is given for each object of that type. For many object types, double-clicking on an entry expands it to show more information. For example, double clicking on a task entry shows all fields of its control block.
(click for larger view)
smxAware supports task-specific breakpoints for IAR C-SPY.
SMX Add-on Module Objects Displayed
- smxFile
- Disk info, file info for open files.
- smxNS
- Net status, buffers status, ARP status, route status.
- smxUSBD
- Device controller name, function drivers registered, endpoint descriptor details.
- smxUSBH
- Host controller name, class drivers registered, plugged-in devices, endpoint descriptor details.
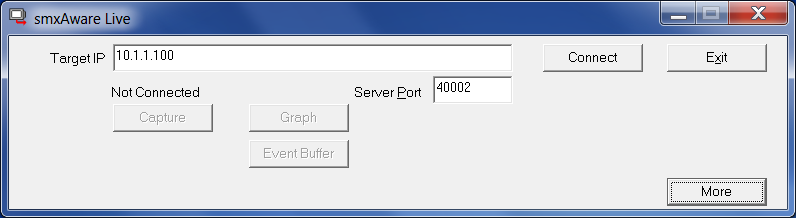
smxAware Live
smxAware Live is a tool that connects to your target device remotely via TCP/IP while it is running in the field. It allows capturing data with minimal intrusion into the running system, and then displays the same graphs available from smxAware GAT. Connection is simple from the smxAware Live control panel. Enter the Target IP address, and then click Connect, to connect to smxNS on the target. The Capture button reads the event buffer from the target during idle time. The Graph and Event Buffer buttons show the graphs, as above. The More button expands the window to show communication with the target, to help resolve any connection problems.
smxAware Live is available as an extra-cost option.
|