
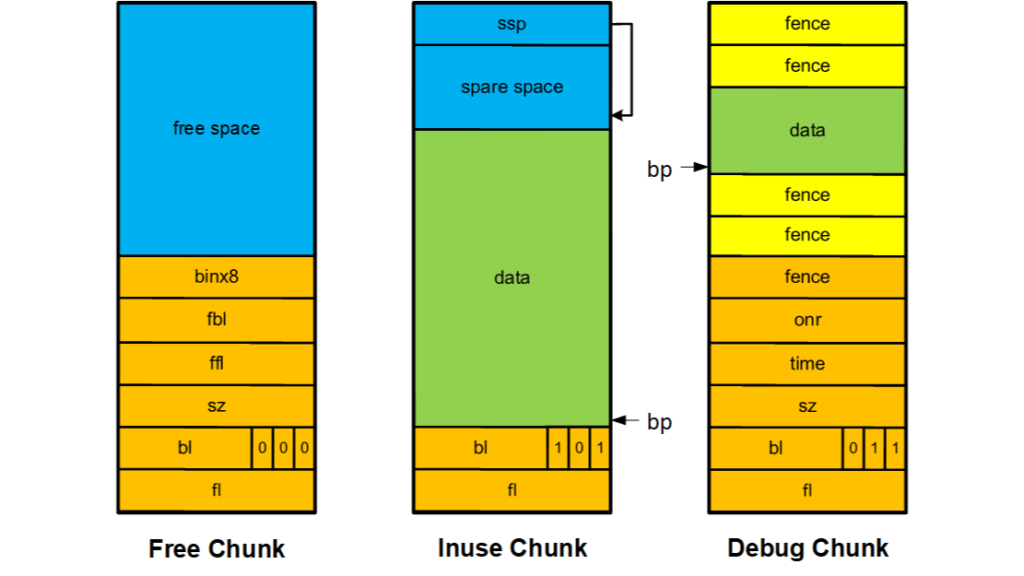
A chunk is the basic unit of a heap. eheap supports three types of chunks:
- Free
- Inuse
- Debug
These are discussed in what follows.
Inuse Chunks
This is the simplest chunk. The inuse chunk control block (ICCB), shown in orange, has a forward link, fl, to the next chunk and a backward link, bl, to the preceding chunk. Thus, an ICCB has a size of 8 bytes. Since chunks are 8-byte aligned, the three least significant link bits are not needed. These are used as the following flags in bl:
- s (bit 2): spare space is present.
- d (bit 1): debug chunk.
- i (bit 0): inuse chunk.
Also in an inuse chunk is the allocated data block, to which the user has been given a pointer. In some inuse chunks there may be spare space at the end of the chunk. If so, the last word contains a pointer to the beginning of the spare space.
As discussed previously [Ref 1], doubly-linked chunks enable continual scanning for broken links and repairing broken links when they are found. This adds a level of reliability that embedded systems require in order to run continuously.
Free Chunks
The free chunk control block (FCCB), shown in orange, has the same fields as the ICCB plus additional fields: forward bin link, fbl, and backward bin link, bbl, are used to link a free chunk into a bin [Ref 2], binx8 is the bin number times 8, and sz is the chunk size. Like the heap, itself, doubly-linked bin lists enable continual scanning for broken links and repairing broken links when found.
An FCCB is 24 bytes in size. The rest of the free chunk contains free space. The largest data block that can be allocated, is free space plus 16 bytes (FCCB size – ICCB size). The smallest data block that can be allocated, is 16 bytes (no free space).
Debug Chunks
The debug chunk control block (DCCB), shown in orange, has the same fields as the ICCB, plus additional fields: sz is the chunk size, time is the elapsed time (etime) at which the chunk was allocated, onr is the task or LSR that owns it, and fence is a known pattern such as 0x55555555. Thus, a debug chunk is an inuse chunk with additional information. In addition, the data block can be surrounded with any number of additional fences as determined at compile time.
Debug chunks are intended to aid debugging. If the debug flag is set for a heap, allocated chunks are debug chunks instead of inuse chunks. This flag can be set and reset at any time. Hence it can be on for all code or only for some code.
Heap Debugging
Heap fences are useful to:
- Detect block overflows and underflows.
- Capture an overflow imprint, in order to help identify its source.
- Contain overflows and underflows so that CCB’s will not be damaged and the system can continue running.
- Delineate data blocks in a debugger memory window.
When a system is stopped, fences can be examined for damage. If a fence is damaged, the owner, time of allocation, and the overflow imprint can be used to help trace the source of the problem. The owner is the most likely culprit, the time of allocation and the overflow imprint may give a clue for what code to look at. Of course, when debugging, data breakpoints can be put at the boundary fences to catch the culprit in action, but block overflows may be occurring when not debugging.
The larger DCCB size plus fences can result in too much overhead for normal operation with available RAM. In that case, debug mode can be turned on only for one or more suspected tasks. It can be turned on by a task’s callback ENTER case and turned of by a task’s callback EXIT case [Ref 3], so that debug mode is on only while that task is running. Debug mode can also be turned on only in certain sections of code. This allows debug chunks to be enabled in new code being debugged and not in code that has already been debugged.
To find memory leaks, the number of fences can be set to 0 to allow all or a large number of allocated chunks to be debug chunks. Then, the time and onr fields in the DCCBs can be used to track down memory leaks. For example, the following chunks would be suspect:
- A old chunk that is supposed to be dynamically allocated and freed.
- A chunk whose owner has been deleted or permanently stopped.
- A chunk that should have been freed after being processed.
Debug chunks can be freely intermixed with inuse and free chunks. However, their larger sizes can cause differences in behavior:
- A debug chunk may come from a different bin than the corresponding inuse chunk.
- Allocation of debug chunks is slower than inuse chunks due to the need to fill fences and extra fields.
These are not show-stoppers, but the user needs to be aware of them.
Conclusion
eheap has three types of chunks: free, inuse, and debug. The debug chunk is helpful for finding heap-usage bugs. The full source code for eheap can be found in eheap.c and eheap.h at www.github.com/Micro-Digital/SecureSMX.
References
- “eheap, Part 1: Basics”, LinkedIn, Ralph Moore, April 2026.
- “eheap, Part 3: Bins”, LinkedIn, Ralph Moore, April 2026.
- “How to Use Task Callbacks”, LinkedIn, Ralph Moore, December 2025.